
SELECTED
ANALYSIS & VISUALIZATION
Go Phils! 311 Scrollytelly
An interactive map︎︎︎ built from scratch in Javascript. Allows the user to scroll through 311 reports in Philadelphia during the 2022 World Series. An experiment in interactive storytelling using time-based geospatial data.
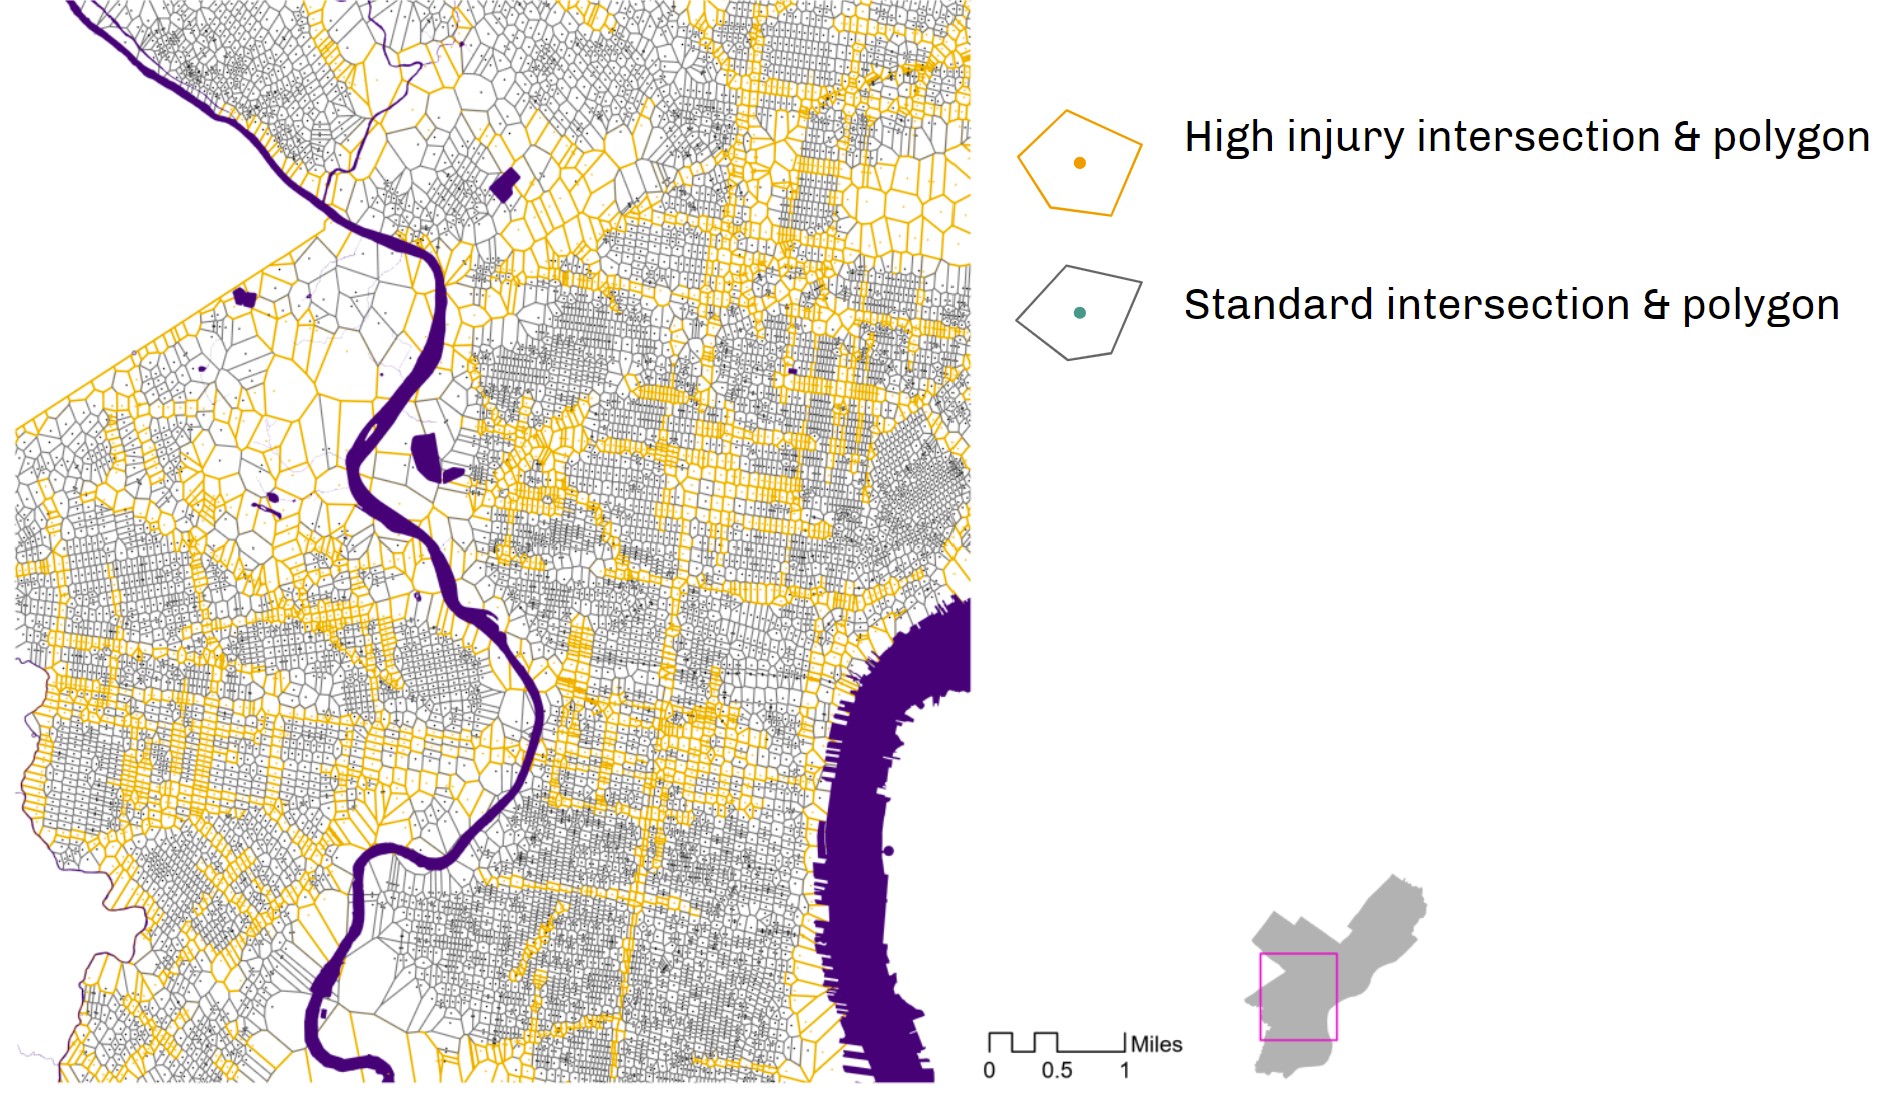
Safety as a Service
Towards Understanding the Gap Between Reported Traffic Conditions and Actual Traffic InjuriesAs a final project in Planning by Numbers: Statistical Data Analysis Using R, I worked with Zoe Yoo to understand the relationship between mobility-related 311 calls and actual traffic crashes, to question if 311 calls are an equitable method of prioritzing city services.
View the final report ︎︎︎
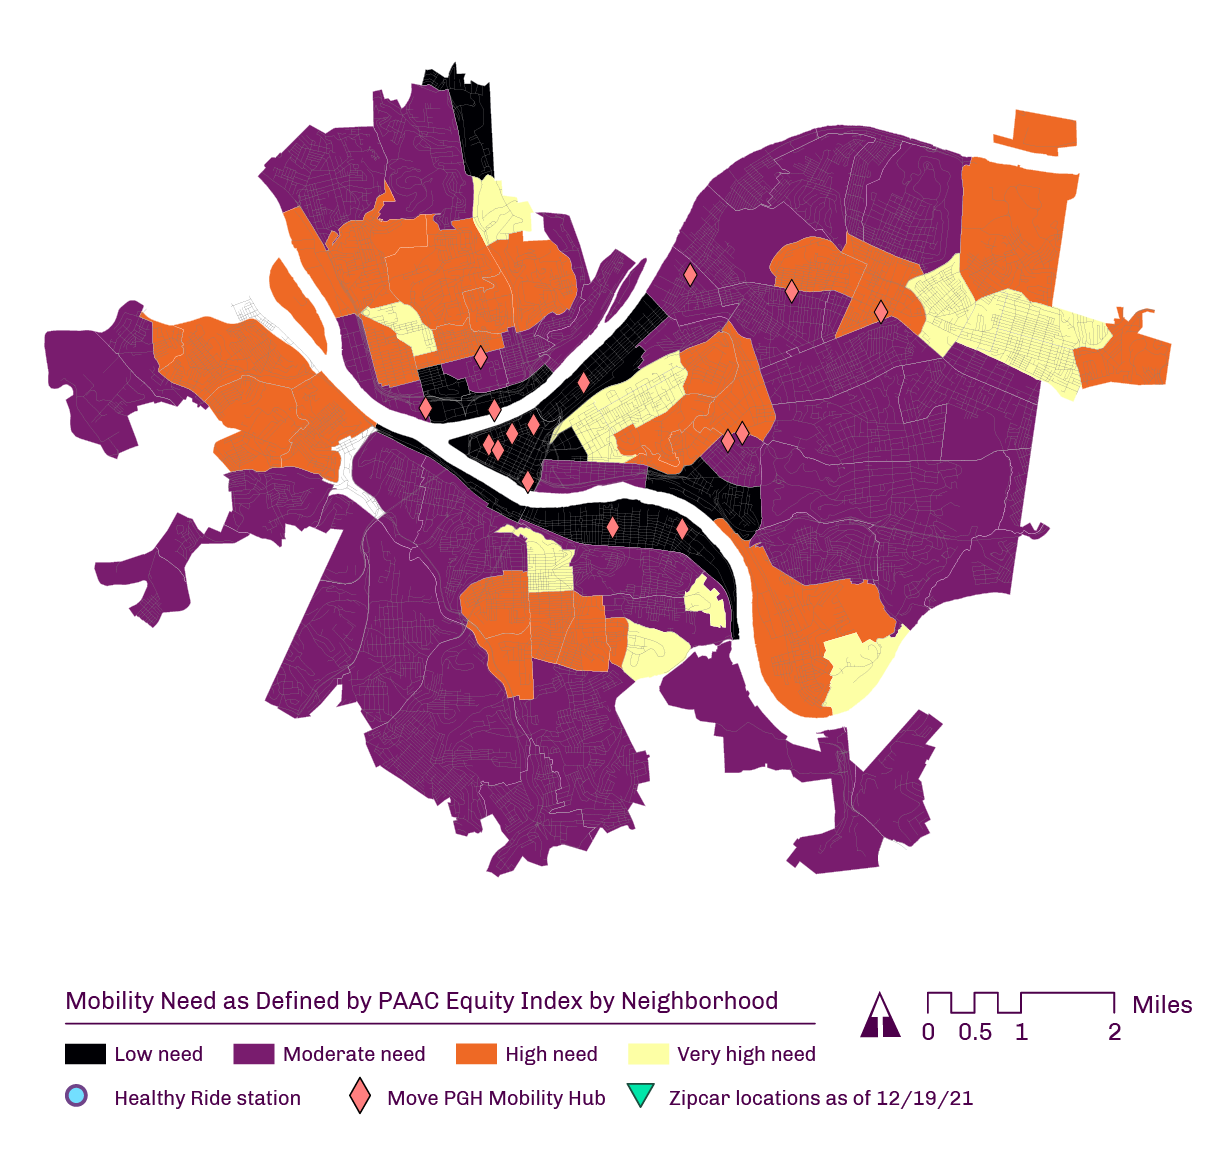
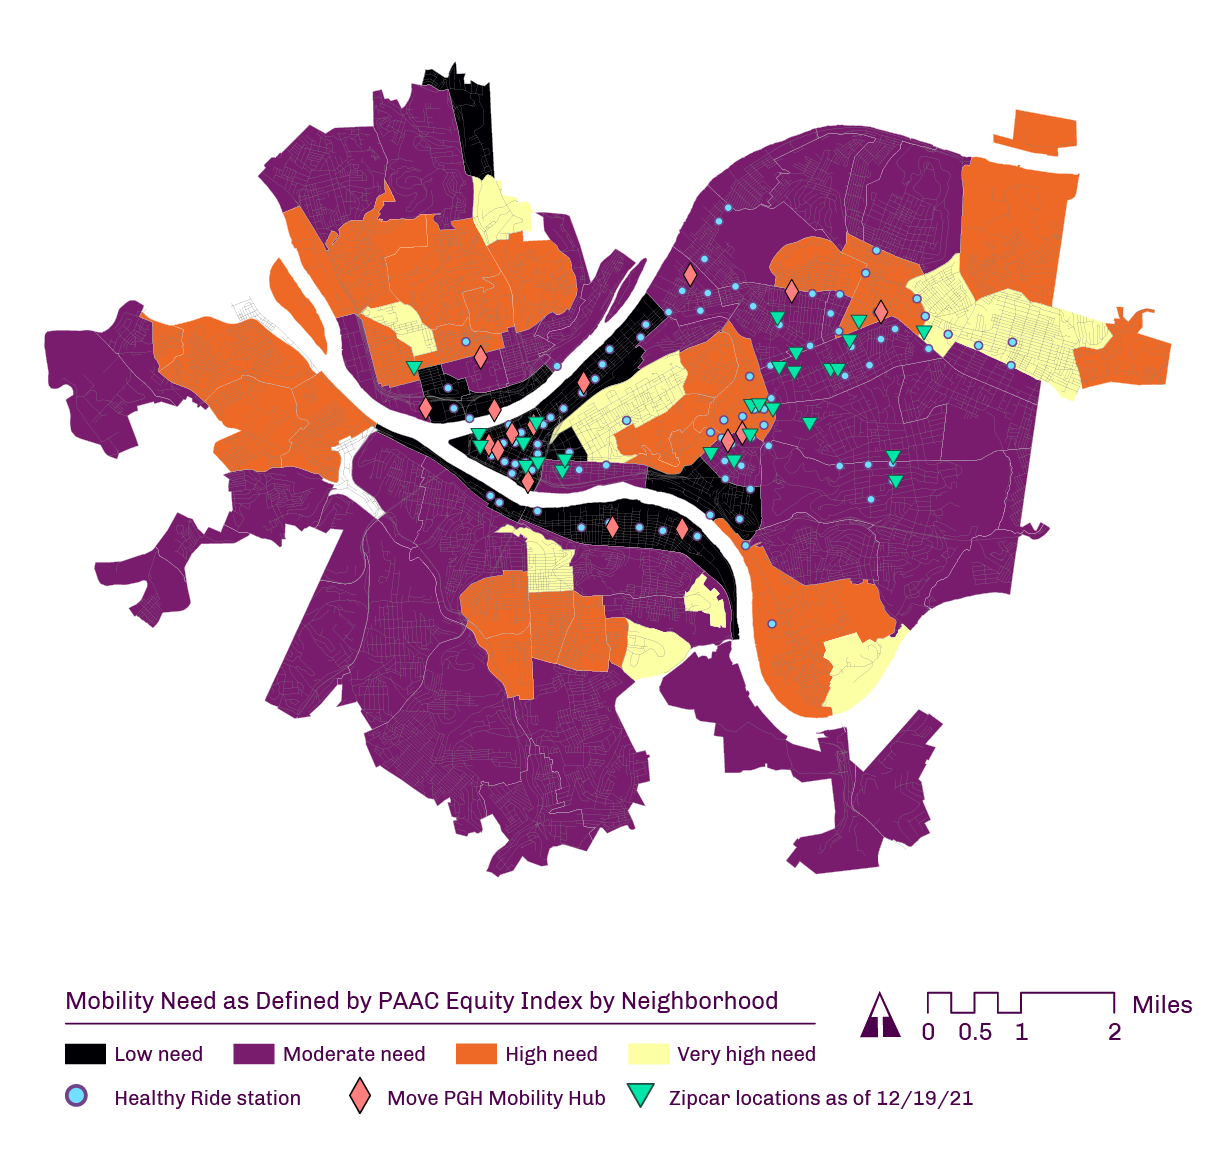
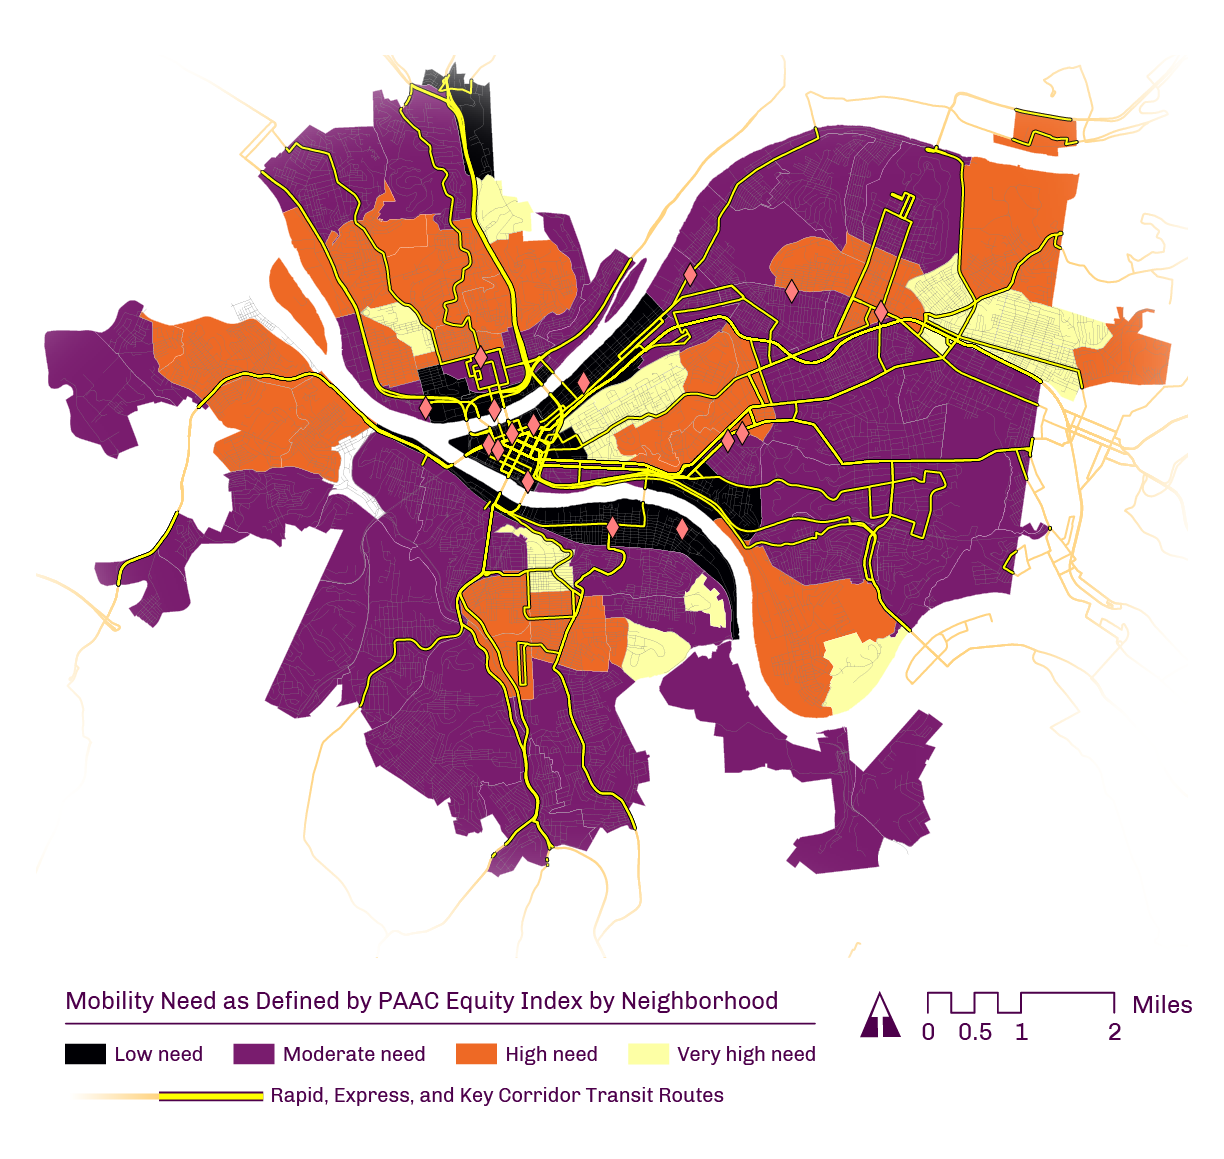
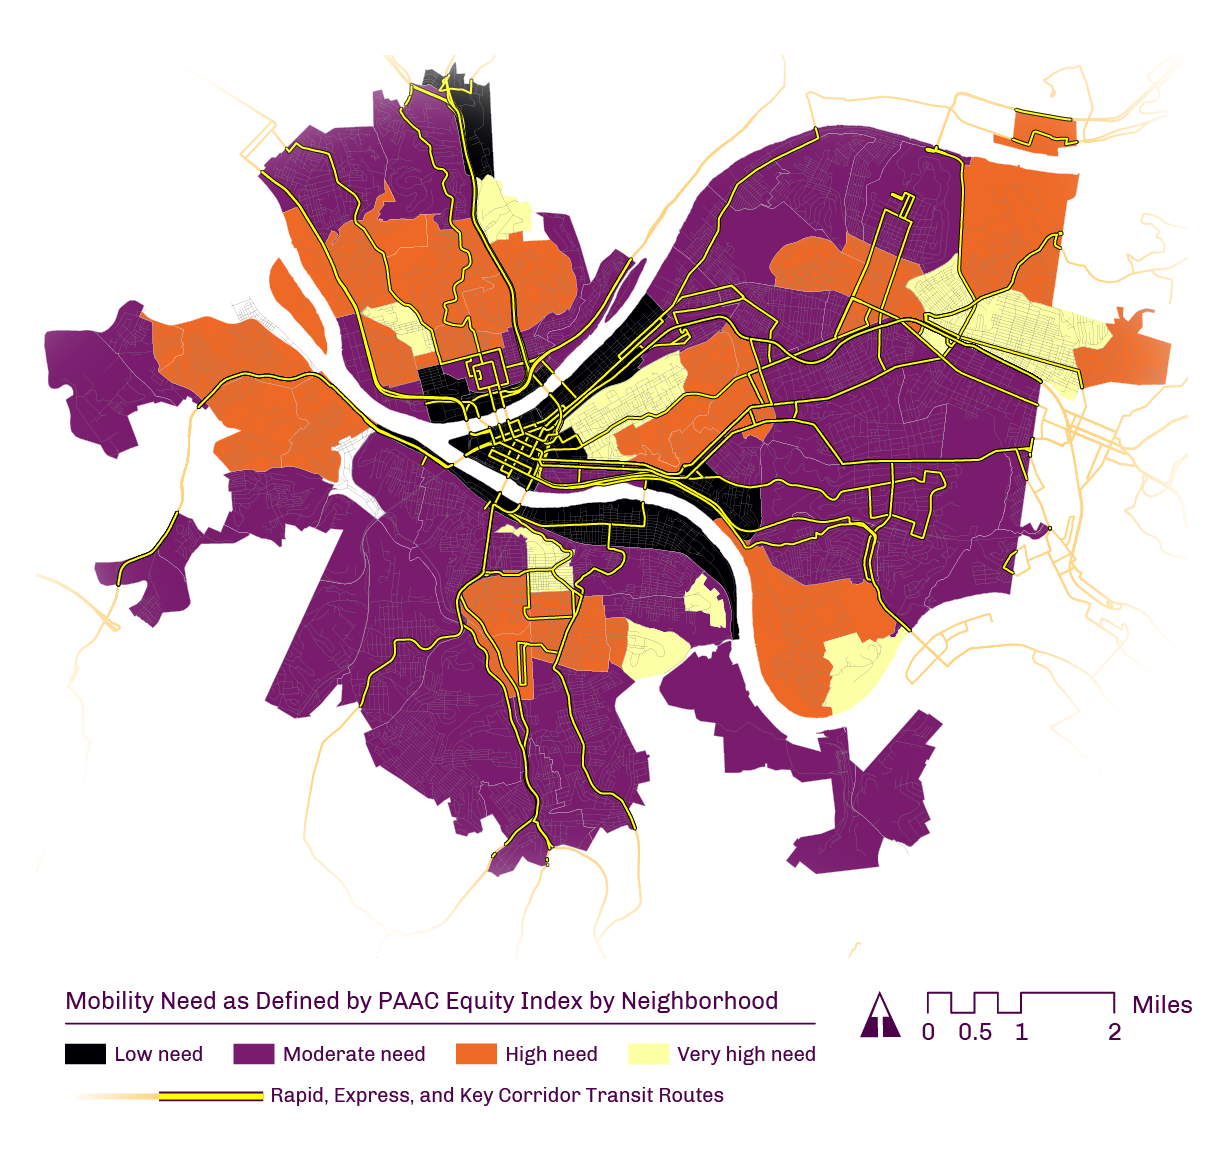
Mobility for Who? Map Series
As co-author on a report︎︎︎ for the advocacy group Pittsburghers for Public Transit, I used ArcGIS and public data to explore if the City of Pittsburgh’s recent investments in high-tech micromobility was serving residents with the highest mobility need.

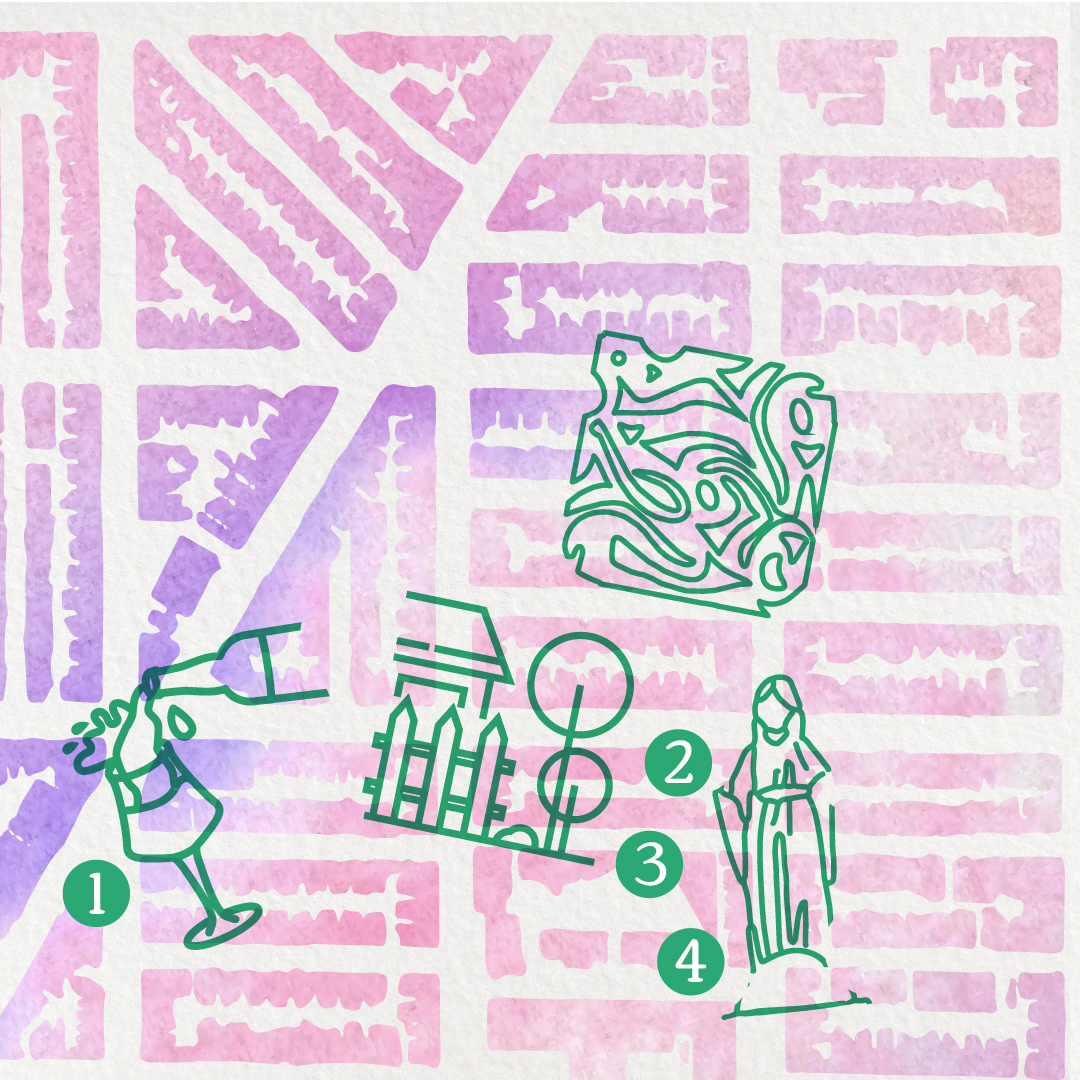
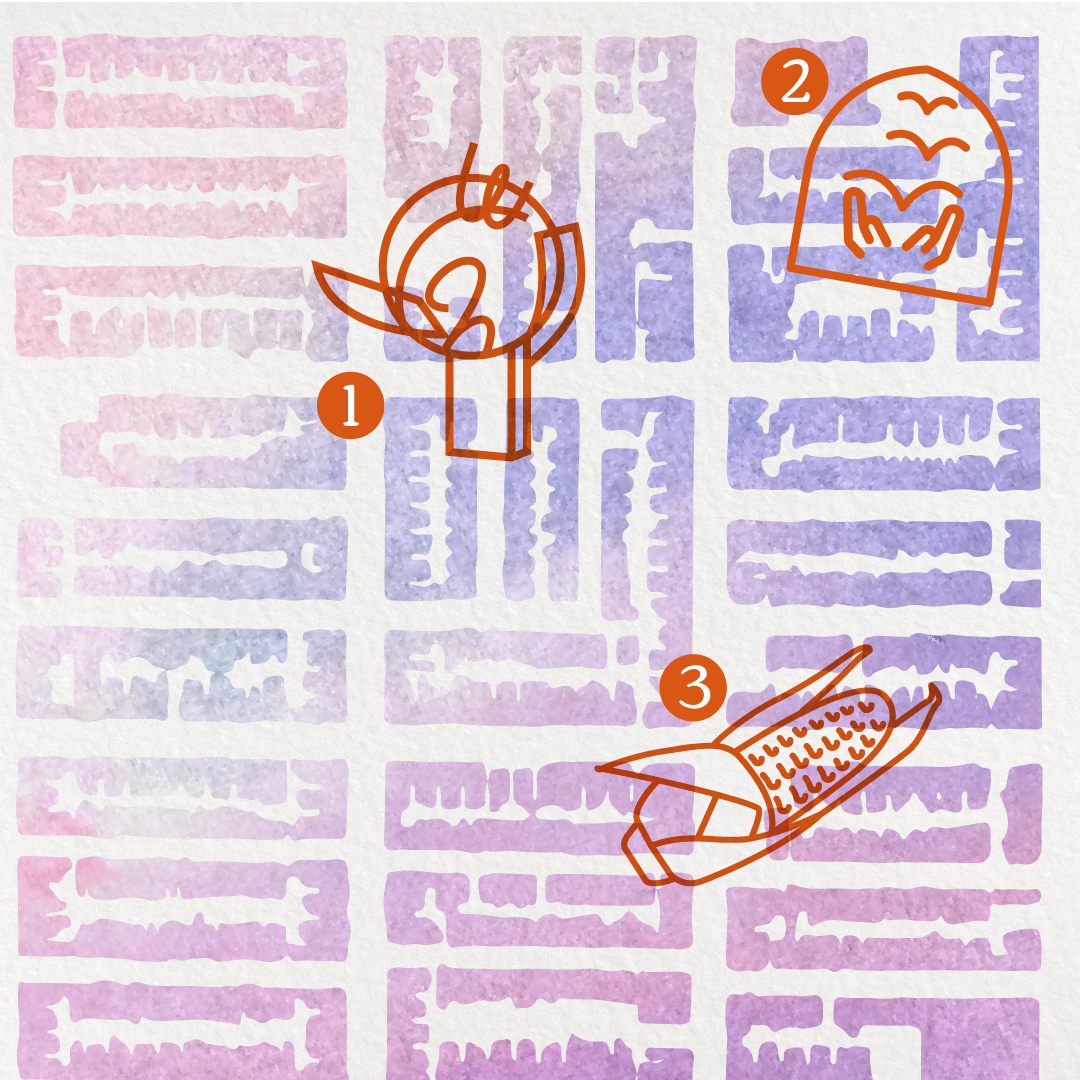
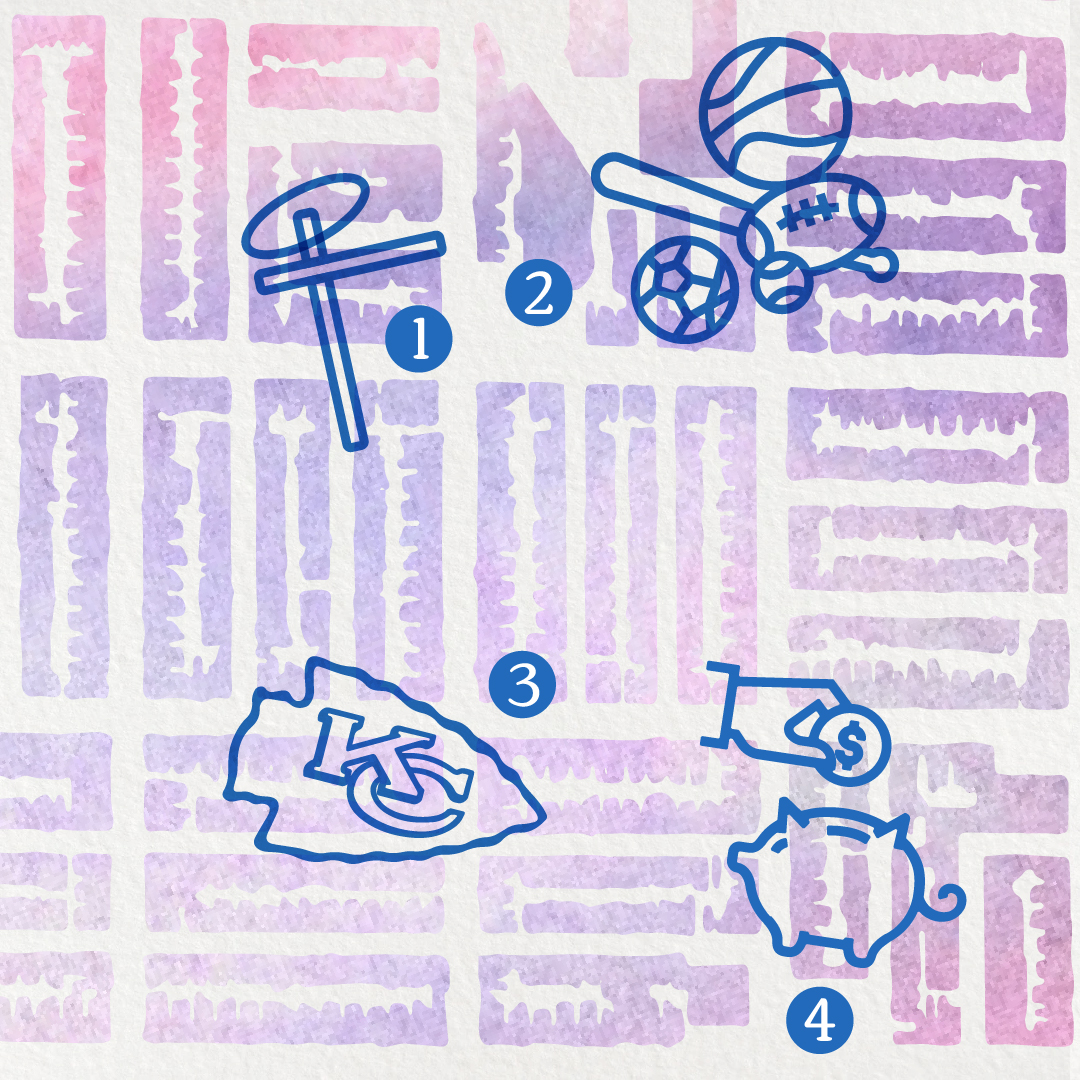
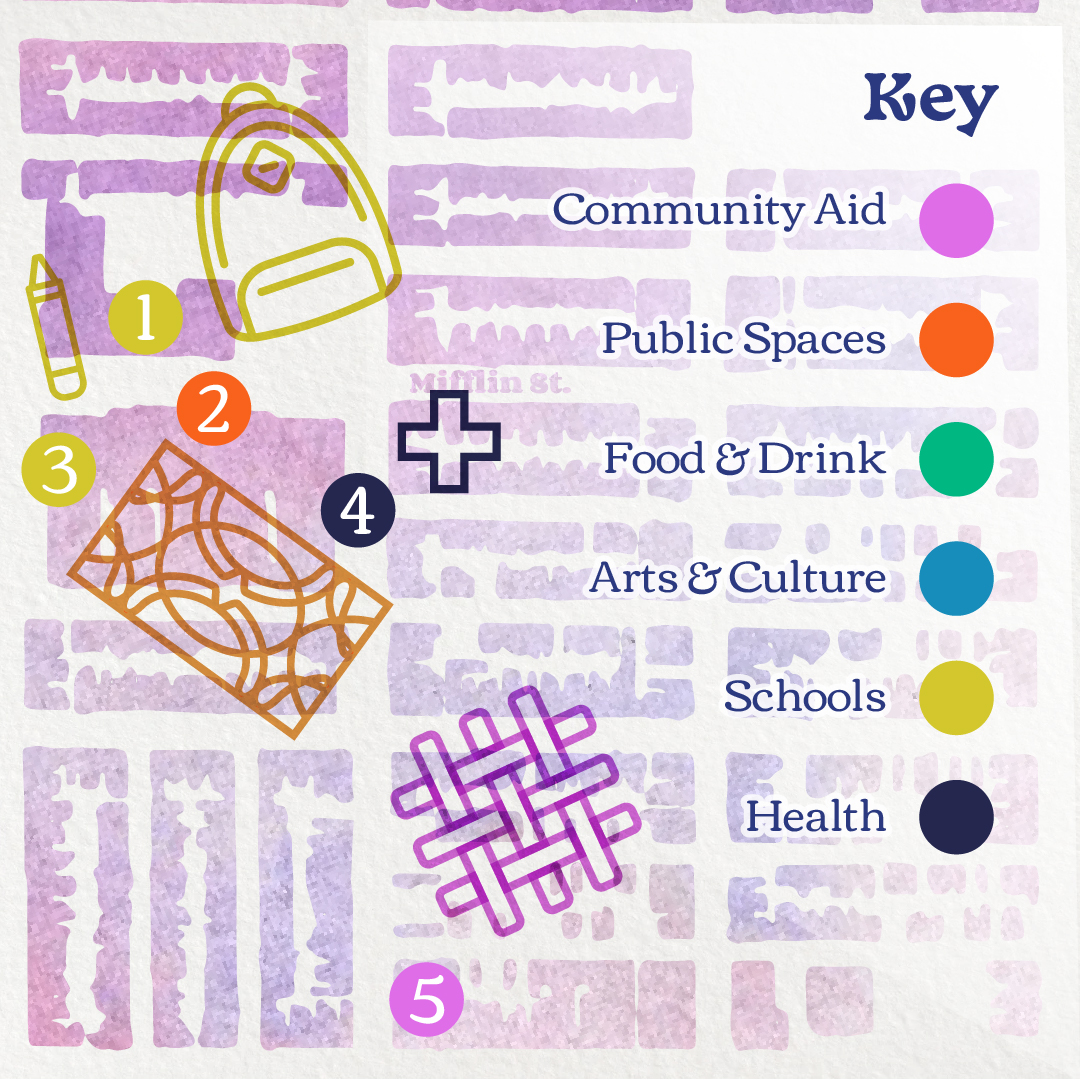
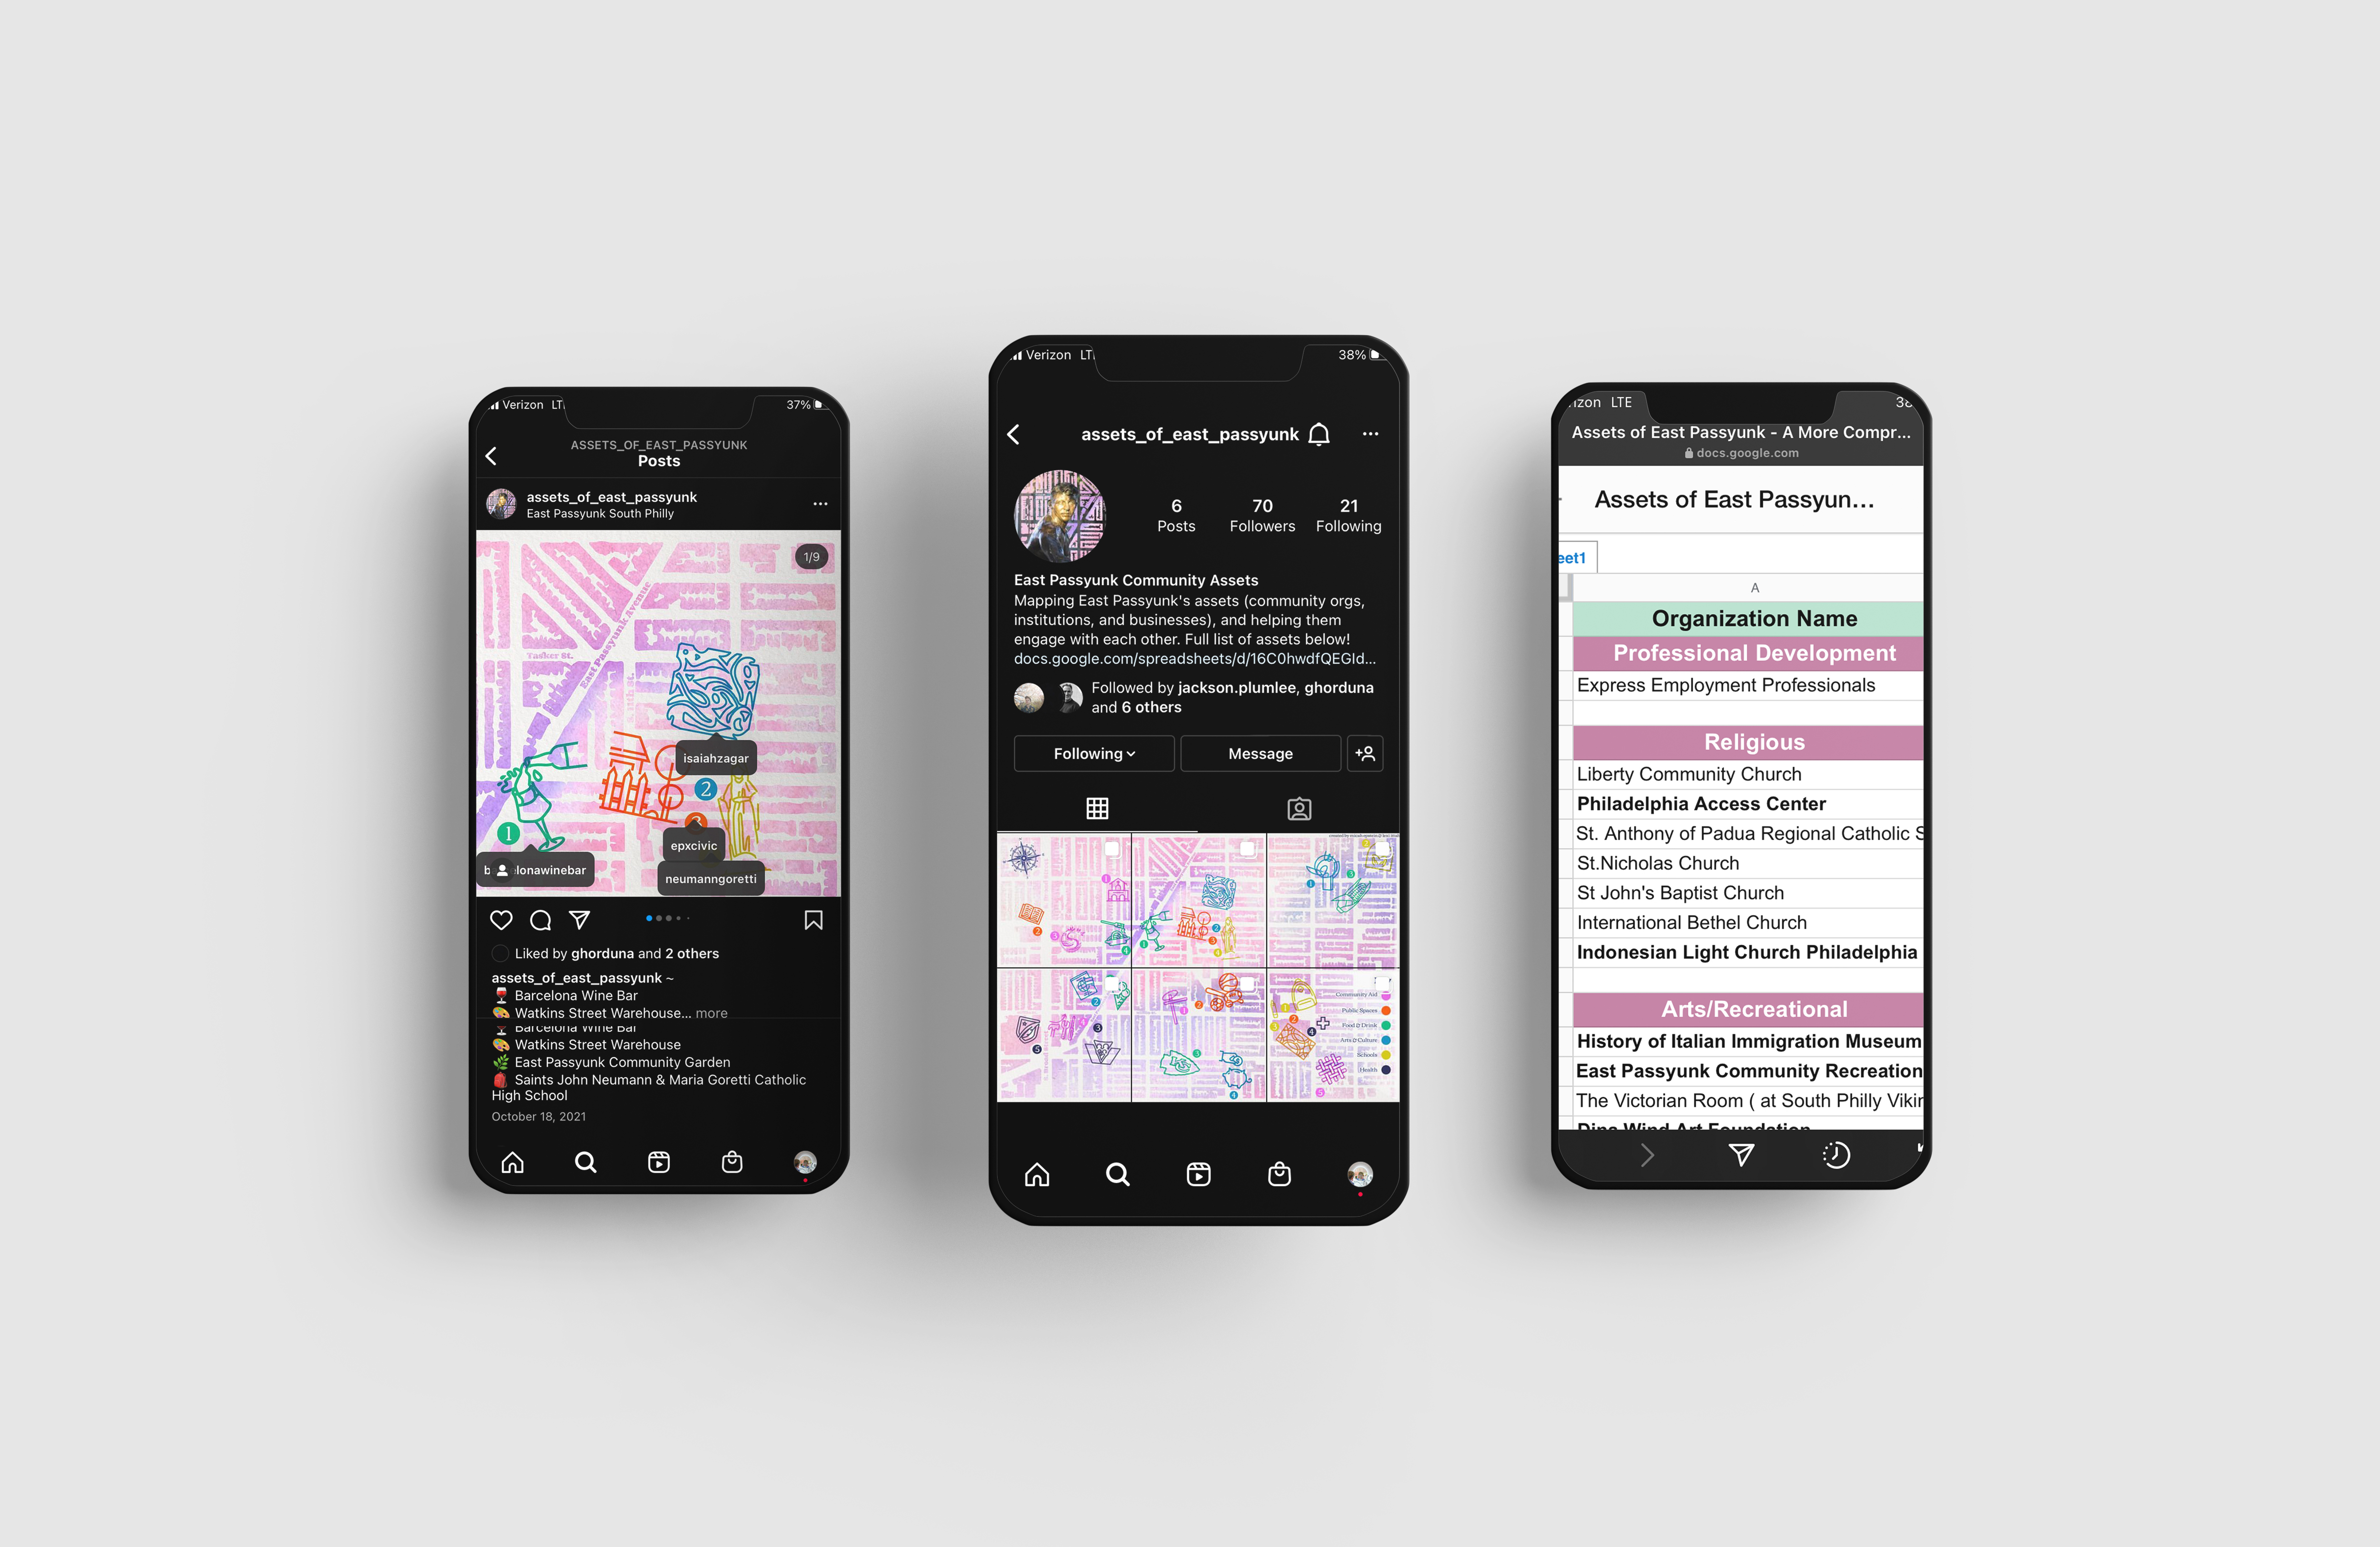
Assets of East Passyunk
Using Instagram︎︎︎ to shout out and build connections between the diverse cultural assets of a trendy South Philadelphia neighborhood.