“search beyond borders”


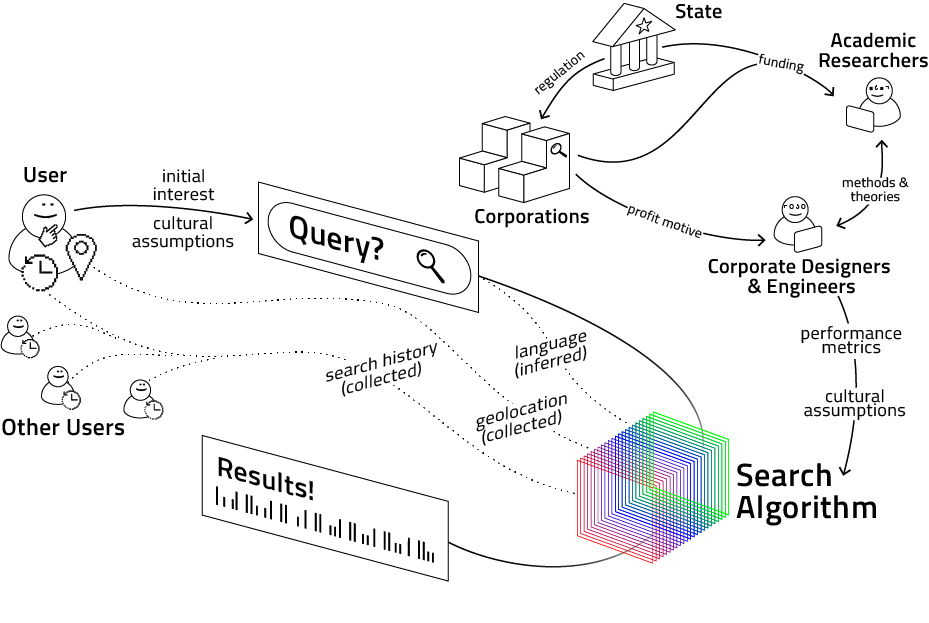
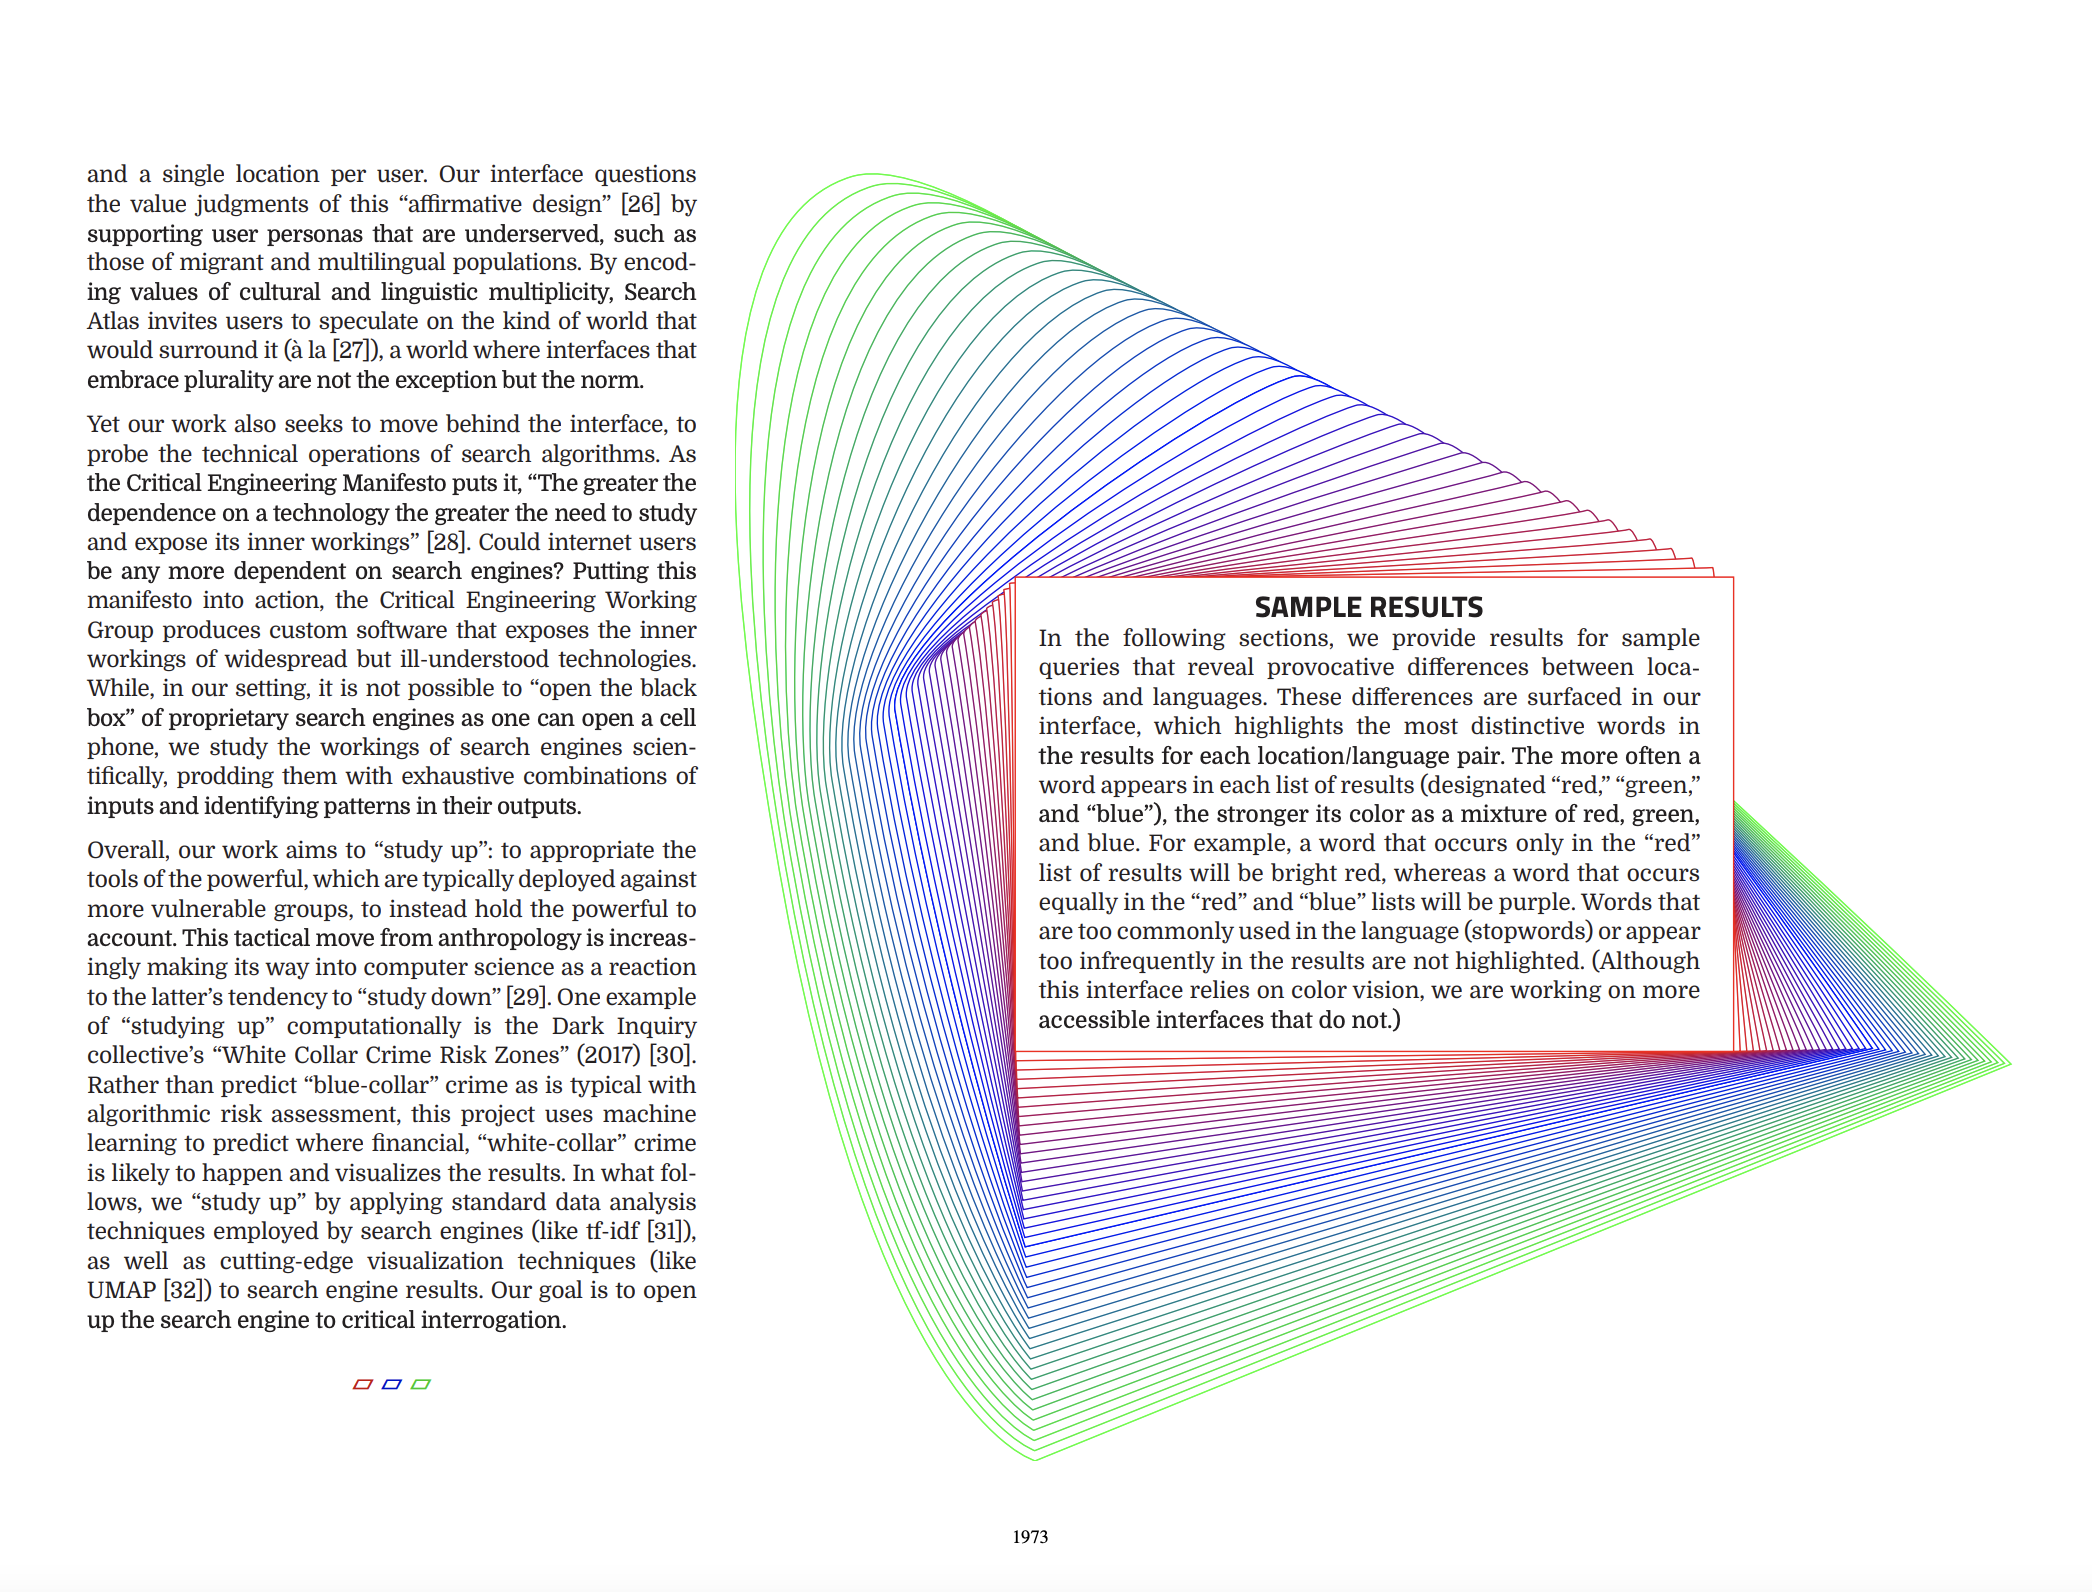
Working closely with the project researchers, I polished data visualizations, created a consistent visual language, and built layouts in InDesign that conform to the high standards of accessibility set by the publishing conference.
I also animated and edited a teaser video to introduce the project - which included one of my first explorations in animated data visualization.


